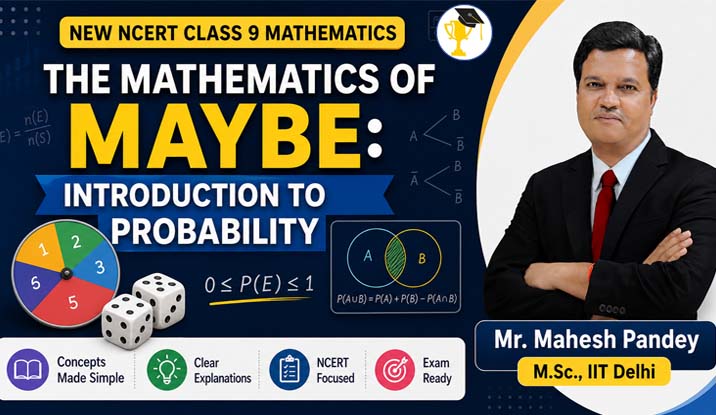
NCERT Class 9 Maths Ganita Manjari Chapter 7 Solutions: The Mathematics of Maybe: Introduction to Probability
Probability is a fascinating branch of mathematics that helps us understand uncertainty and chance in real life. In NCERT Class 9 Maths Ganita Manjari Chapter 7 – “The Mathematics of Maybe”, students learn how to measure and interpret the likelihood of events.
Whether it's predicting rain, winning a match, or being selected in a lucky draw—probability helps us make sense of such uncertain situations.
Chapter 1 – Orienting Yourself: The Use of Coordinates Solutions: Click Now
Chapter 2 – Introduction to Linear Polynomials Solutions: Click Now
Chapter 3 – The World of Numbers Solutions: Click Now
Chapter 4 – Exploring Algebraic Identities Solutions: Click Now
Chapter 5 – I’m Up and Down, and Round and Round Solutions: Click Now
Chapter 6 – Measuring Space: Perimeter and Area Solutions: Click Now
Chapter 7 – The Mathematics of Maybe: Introduction to Probability Solutions: Click Now
Chapter 8 – Predicting What Comes Next: Exploring Sequences and Progressions Solutions: Click Now
7.1 What is Probability?
Probability is a type of measurement, just like length, area, or volume. However, instead of measuring physical quantities, it measures the likelihood (chance) of an event occurring.
It helps us answer questions like:
- Will it rain today?
- Will our school win the hockey match?
- Will I be selected in a lucky draw?
These are called random events.
We know the possible outcomes, but we cannot predict the exact result in advance. This uncertainty is what probability deals with.
Class 9 Maths Ganita Manjari Complete NCERT Solutions: Download Now
7.1.1 What is Randomness?
Randomness refers to situations where outcomes cannot be predicted with certainty.
Examples:
- Tossing a coin
- Rolling a dice
- Picking a random name
Even though all possible outcomes are known, the exact result is uncertain.
7.1.2 The Probability Scale
Probability is measured on a scale from 0 to 1.
0≤P(E)≤10 \leq P(E) \leq 10≤P(E)≤1
Interpretation:
- 0 → Impossible Event
- 1 → Certain Event
- Between 0 and 1 → Likely Event
Example:
If probability = 0.75 → There is a 75% chance the event will occur.
Class 9 Maths Ganita Manjari Complete NCERT Solutions: Download Now
Probability Formula
P(E)=Number of favourable outcomesTotal number of outcomesP(E) = \frac{\text{Number of favourable outcomes}}{\text{Total number of outcomes}}P(E)=Total number of outcomesNumber of favourable outcomes?
7.2 Measuring Probability Objectively
Probability can be measured using two main approaches:
7.2.1 Experimental Probability
This is based on actual experiments or observations.
P(E)=Number of times event occursTotal number of trialsP(E) = \frac{\text{Number of times event occurs}}{\text{Total number of trials}}P(E)=Total number of trialsNumber of times event occurs?
Example:
If a coin is tossed 10 times and head appears 6 times:
Probability of head = 6/10 = 0.6
7.2.2 Theoretical Probability
This is based on logical reasoning and all possible outcomes, without performing experiments.
Example:
- Probability of head in a fair coin = 1/2
7.2.3 Analysing Statistical Data Using Probability
Probability helps in analyzing real-world data, such as:
- Weather reports
- Sports statistics
- Market trends
7.3 Elements of Probability: Sample Space and Events
Sample Space
The set of all possible outcomes is called the sample space.
Example:
Coin toss → {Head, Tail}
7.3.2 Events
An event is a subset of the sample space.
Example:
Getting a head → Event
Class 9 Maths Ganita Manjari Complete NCERT Solutions: Download Now
7.4 Tree Diagrams
Tree diagrams help us visualize all possible outcomes in a step-by-step way.
Example:
Two coin tosses:
Total outcomes = 4
Tree diagrams are very useful in solving complex probability problems.
Solved Examples
Example 1: Coin Toss
Probability of getting Head:
- Total outcomes = 2
- Favorable outcomes = 1
Answer = 1/2
Example 2: Dice Roll
Probability of even number:
- Even numbers = {2, 4, 6}
- Total outcomes = 6
Answer = 3/6 = 1/2
Example 3: Card Selection
Probability of red card:
- Red cards = 26
- Total cards = 52
Answer = 1/2
NCERT Exercise Solutions (Sample)
Class 9 Maths Ganita Manjari Complete NCERT Solutions: Download Now
Q1. Classify events:
| Event |
Type |
| Sun rises in the East |
Sure |
| Getting 8 on dice |
Impossible |
| Rain tomorrow |
Likely |
Q2. Probability of Tail
Answer = 1/2
Q3. Number less than 3 on dice
Answer = 2/6 = 1/3
Chapter 1 – Orienting Yourself: The Use of Coordinates Solutions: Click Now
Chapter 2 – Introduction to Linear Polynomials Solutions: Click Now
Chapter 3 – The World of Numbers Solutions: Click Now
Chapter 4 – Exploring Algebraic Identities Solutions: Click Now
Chapter 5 – I’m Up and Down, and Round and Round Solutions: Click Now
Chapter 6 – Measuring Space: Perimeter and Area Solutions: Click Now
Chapter 7 – The Mathematics of Maybe: Introduction to Probability Solutions: Click Now
Chapter 8 – Predicting What Comes Next: Exploring Sequences and Progressions Solutions: Click Now
Real-Life Applications
Probability is used in:
- Weather forecasting
- Data analysis
- Games & sports
- Stock market
- AI & Machine Learning
Important Tips
Understand randomness clearly
Always write sample space
Practice numerical questions
Revise formulas regularly
Exam Strategy
- Focus on NCERT questions
- Practice examples daily
- Use tree diagrams for clarity
- Avoid calculation mistakes
Class 9 Maths Ganita Manjari Complete NCERT Solutions: Download Now
 STUDY MATERIALS
 COURSES
 MORE
MORE