Q 1 :    

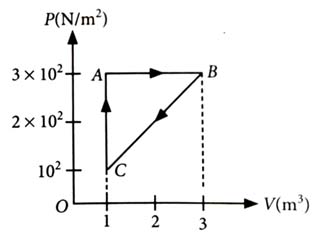
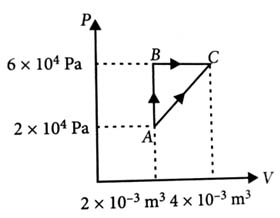
For the given cycle, the work done during isobaric process is             [2023]

[IMAGE 106]

  • 200 J


  • Zero


  • 400 J


  • 600 J


(4)

As AB is isobaric process, work done (WAB)=3×10²(3-1)=600J


Q 2 :    

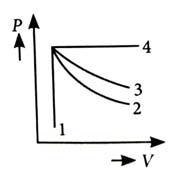
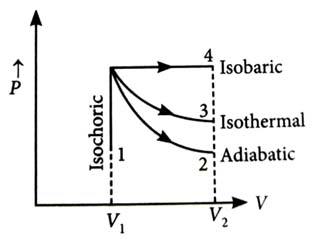
An ideal gas undergoes four different processes from the same initial state as shown in the figure below. Those processes are adiabatic, isothermal, isobaric and isochoric. The curve which represents the adiabatic process among 1, 2, 3 and 4 is             [2022]

[IMAGE 107]

  • 1


  • 2


  • 3


  • 4


(2)

When a thermo-dynamic system undergoes a change in such a way that there is no exchange of heat with the surrounding, then the process is known as adiabatic process and the slope of adiabatic is more than isothermal.

[IMAGE 108]


Q 3 :    

Two cylinders A and B of equal capacity are connected to each other via a stopcock. A contains an ideal gas at standard temperature and pressure. B is completely evacuated. The entire system is thermally insulated. The stopcock is suddenly opened. The process is             [2020]

  • isothermal  


  • adiabatic  


  • isochoric  


  • isobaric  


(2)

Since the entire system is thermally insulated, no heat flows into the system. When the stopcock is removed, the gas expands adiabatically.


Q 4 :    

In which of the following processes, heat is neither absorbed nor released by a system?               [2019]

  • isochoric


  • isothermal


  • adiabatic


  • isobaric


(3)

Adiabatic process is the process in which no exchange of heat energy takes place between the gas and the surroundings,

i.e., ΔQ = 0.


Q 5 :    

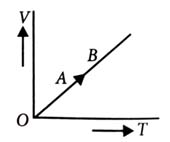
The volume (V) of a monatomic gas varies with its temperature (T), as shown in the graph. The ratio of work done by the gas, to the heat absorbed by it, when it undergoes a change from state A to state B, is              [2018]

[IMAGE 109]

  • 2/5


  • 2/3


  • 1/3


  • 2/7


(1)

Given process is isobaric.

dQ=nCpdT  where Cp is specific heat at constant pressure.

or   dQ=n(52R)dT

Also, dW=PdV=nRdT                              (PV=nRT)

Required ratio =dWdQ=nRdTn(52R)dT=25


Q 6 :    

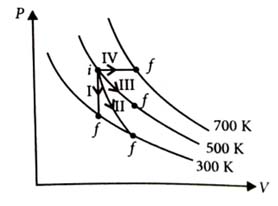
Thermodynamic processes are indicated in the following diagram.            [2017]

[IMAGE 110]

Match the following.

  Column-1   Column-2
P. Process I A. Adiabatic
Q. Process II B. Isobaric
R. Process III C. Isochoric
S. Process IV D. Isothermal


  • P → C, Q → A, R → D, S → B


  • P → C, Q → D, R → B, S → A


  • P → D, Q → B, R → A, S → C


  • P → A, Q → C, R → D, S → B


(1)

In process I, volume is constant.

      Process I → Isochoric; P → C

As slope of curve II is more than the slope of curve III,

Process II → Adiabatic and Process III → Isothermal

     Q → A, R → D

In process IV, pressure is constant. Process IV → Isobaric; S → B


Q 7 :    

One mole of an ideal monatomic gas undergoes a process described by the equation PV3=constant. The heat capacity of the gas during this process is          [2016]
 

  • 32R


  • 52R


  • 2R


  • R


(4)

Process described by the equation,

PV3=constant

For a polytropic process, PVα=constant

         C=CV+R1-α=32R+R1-3=R


Q 8 :    

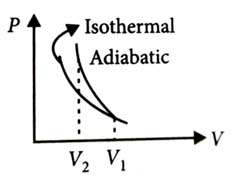
A gas is compressed isothermally to half its initial volume. The same gas is compressed separately through an adiabatic process until its volume is again reduced to half. Then   [2016]

  • Compressing the gas isothermally or adiabatically will require the same amount of work.


  • Which of the case (whether compression through isothermal or through adiabatic process) requires more work will depend upon the atomicity of the gas.


  • Compressing the gas isothermally will require more work to be done.


  • Compressing the gas through adiabatic process will require more work to be done.


(4)

[IMAGE 111]

V1=V, V2=V/2

On P–V diagram, Area under adiabatic curve > Area under isothermal curve.
So, compressing the gas through adiabatic process will require more work to be done.


Q 9 :    

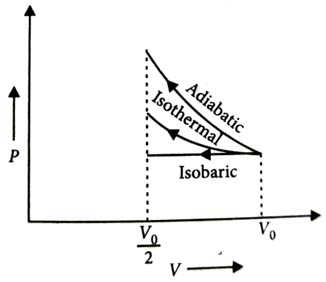
An ideal gas is compressed to half its initial volume by means of several processes. Which of the process results in the maximum work done on the gas?      [2015]

  • Isochoric


  • Isothermal


  • Adiabatic


  • Isobaric


(3)

[IMAGE 112]

The P-V diagram of an ideal gas compressed from its initial volume V0 to V02 by several processes is shown in the figure.

Work done on the gas = Area under P-V curve.

As area under the P-V curve is maximum for adiabatic process, so work done on the gas is maximum for adiabatic process.


Q 10 :    

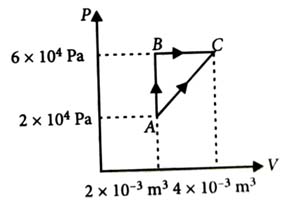
Figure below shows two paths that may be taken by a gas to go from a state A to a state C. In process AB, 400 J of heat is added to the system and in process BC, 100 J of heat is added to the system. The heat absorbed by the system in the process AC will be         [2015]

[IMAGE 113]

  • 460 J


  • 300 J


  • 380 J


  • 500 J


(1)

[IMAGE 114]

As initial and final points for two paths are same so

ΔUABC=ΔUAC

AB is isochoric process.

         ΔWAB=0

QAB=ΔUAB=400 J

BC is isobaric process.

ΔQBC=ΔUBC+ΔWBC

100=ΔUBC+6×10⁴(4×10⁻³-2×10⁻³)

100=ΔUBC+12×10

ΔUBC=100-120=-20J

As, ΔUABC=ΔUAC,  ΔUAB+ΔUBC=ΔQAC-ΔWAC

400-20=ΔQAC-(2×104×2×10-3+12×2×10-3×4×104)

ΔQAC=460J